“Logstash输出自定义结构数据”
背景
最近接到一个任务,需要统计数据库的业务指标,然后日志需要在Kibana上显示,并且需要根据日志内容构建图形展示。 比如日志输出的内容是
{
    "timestamp" : "2019-12-17T05:00:08Z",
    "count" : 324
}
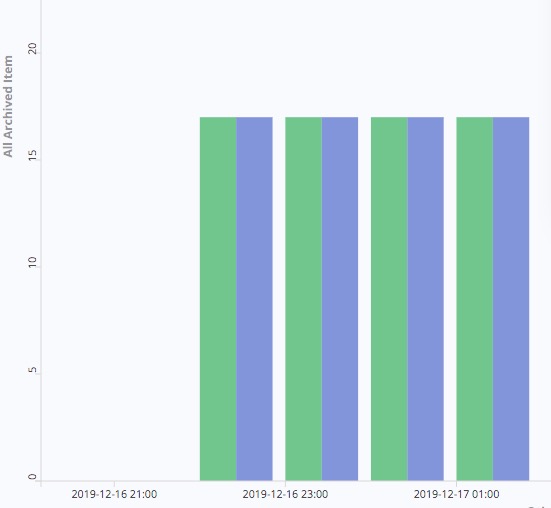
其他字段忽略不计,我需要构建一个柱状图,横坐标是时间,纵坐标是数量。
logstash输出自定义字段
当前我们项目所有的日志,是通过logger.info()/logger.error()/logger.warn()来打印,那么通过logstash送出去的日志格式是
{
    "timestamp" : "yyyy-MM-dd'T'HH:mm:ss.SSSZZ",
    "thread_name" : "com.my.service",
    "message" : "the output log",
    "other fields" : "..."
}
通过logger.info等方法输出的内容会在message里面呈现。而且只是字符串类型,不符合预期。 搜索一番之后,我发现有两种方式可以输出自定义字段。
- 修改logstash配置 在logstash的filter中添加json插件,这个插件可以将指定字段序列化,假如在message中打印的日志是
{
    "attr1" : "value1",
    "number" : 10
}
我们希望将json文件的内容展开成 修改logstash.conf文件
filter {
    json {
        source => "message"
        skip_on_invalid_json => true
    }
}
source对应要处理的字段,这里我们指定message,skip_on_invalid_json指的是如果json解析失败就忽略。配置完成之后,再次发送日志,日志格式会变成
{
    "timestamp" : "yyyy-MM-dd'T'HH:mm:ss.SSSZZ",
    "thread_name" : "com.my.service",
    "message" : "the output log",
    "attr1" : "value1",
    "number" : 10,
    "other fields" : "..."
}
- 在代码中输出自定义格式的日志 我们用的logstash框架是logstash-logback-encoder,这个框架提供了添加自定义字段的功能自定义字段参考 输出日志的时候有两种方式输出日志
- structured arguments,这是StructuredArguments提供的机制
-
markers,这是Markers提供的功能
- structured arguments的用法:
import static net.logstash.logback.argument.StructuredArguments.*;

//Add "name":"value" to the JSON output
//The formatted message will be `log message value`
logger.info("log message {}", value("name", "value"));

//Add "name":"value" to the JSON output,
//The formatted message will be `log message name=value`
logger.info("log message {}", keyValue("name", "value"));

//Add "name":"value" ONLY to the JSON output.
//the formatted message will NOT contain the key/value.
logger.info("log message", keyValue("name", "value"));

//Add multiple key value pairs to both JSON and formatted message
//add name=[value] to the formatted message using a custom format.
logger.info("log message {}", keyValue("name", "value", "{0}=[{1}]"));

//values will be serialized by Jackson's ObjectMapper.
//The formatted message will be `log message <result of foo.toString()>`
Foo foo  = new Foo();
logger.info("log message {}", value("foo", foo));

//Add "name1":"value1","name2":"value2" to the JSON output by using a Map,
//and add `myMap.toString()` to the formatted message.
Map myMap = new HashMap();
myMap.put("name1", "value1");
myMap.put("name2", "value2");
logger.info("log message {}", entries(myMap));

//Add "array":[1,2,3] to the JSON output,
//and array=[1,2,3] to the formatted message.
logger.info("log message {}", array("array", 1, 2, 3));

// Add fields of any object that can be unwrapped by Jackson's UnwrappableBeanSerializer to the JSON output.
//The formatted message will contain `myobject.toString()`
logger.info("log message {}", fields(myobject));

//In order to normalize a field object name, static helper methods can be created.
//For example, `foo(Foo)` calls `value("foo" , foo)`
logger.info("log message {}", foo(foo));
- markers的用法:
import static net.logstash.logback.marker.Markers.*;

//Add "name":"value" to the JSON output.
logger.info(append("name", "value"), "log message");

//Add "name1":"value1","name2":"value2" to the JSON output by using multiple markers.
logger.info(append("name1", "value1").and(append("name2", "value2")), "log message");

//Add "name1":"value1","name2":"value2" to the JSON output by using a map.
Map myMap = new HashMap();
myMap.put("name1", "value1");
myMap.put("name2", "value2");
logger.info(appendEntries(myMap), "log message");

//Add "array":[1,2,3] to the JSON output
logger.info(appendArray("array", 1, 2, 3), "log message");

//Add "array":[1,2,3] to the JSON output by using raw json.
logger.info(appendRaw("array", "[1,2,3]"), "log message");

//Add any object that can be serialized by Jackson's ObjectMapper
logger.info(append("object", myobject), "log message");

//Add fields of any object that can be unwrapped by Jackson's UnwrappableBeanSerializer.
logger.info(appendFields(myobject), "log message");
Kibana创建图形
前一步logstash配置完成之后,输出的日志格式是
{
    "Tag": "CustomTag",
    "Count" : 100,
    "timestamp" : "2019-12-18T10:00:00Z"
}
现在需要在Kibana中创建图形
- 进入Kibana(7.0.1)操作界面
- 点击”Visualize”菜单
- 点击创建按钮(➕)
- 选择Vertical Bar
- 之后需要选择一个index,某个index表示一系列数据的集合
- 之后进入图形的配置界面,如图
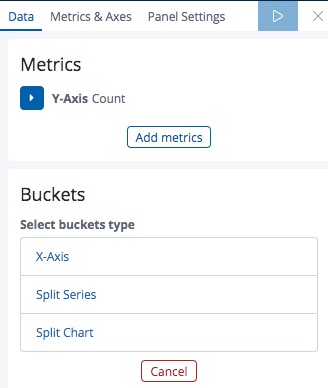
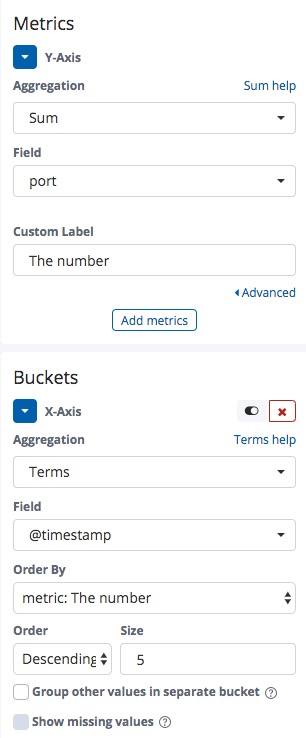
- Y-Axis的Aggregation改成Sum,sum表示数值的合,我们需要展示的就是数值,Field选择Count,label表示图形显示的标签
- 然后在Buckets添加一个X-Axis,这个是横坐标的值,Aggregation选择Terms,Filed选择timestamp,Order by和Order就用默认的配置,然后点击”Apply Changes”按钮查看生成的图形,配置界面
- 点击Save按钮,输入Visualization的名字,保存创建的图形
将Visualization添加到Dashboard
- 点击Dashboard菜单,可以创建新的Dashboard也可以选择已有的Dashboard
- 点击Edit –> Add会弹出Visualization的选择框
- 按照Visualization的名字搜索图形,点击图形就可以把创建的图形添加到Dashboard.
结论
这边文章介绍了如何自定义Logstash输出的字段,以及如何创建一个Kibana的图形。自定义logstash可以通过修改logstash配置文件或者在代码中使用logstash框架提供的功能来实现。 Kibana中Visualization菜单提供了各种样式的图形,可以根据已有的数据来构建目标图形。